At Lightspeed, we are unabashedly long on the SMB market. The crux of our thesis is simple: SMBs are the lifeblood of our economy, there are over 60 million small businesses between the US and Europe alone, and we’re still in the early innings on tools and infrastructure to remove the administrative burdens required to run a small business. The explosion of creators, merchants, and solopreneurs underscores the opportunity. We’re proud at Lightspeed to have invested early along this trend, when skeptics criticized the market as difficult to achieve sustainable unit economics or having low public market multiples. Over the last several years, we’ve invested globally in companies like Carta, ClickUp, Elementor, Faire, Found, Frubana, Handshake, Mynd, Payhawk, Personio, Trendsi, TripActions, Udaan, Vinted, Xentral, and many more.
We define SMB focused software companies as those with $12k or lower ACV ($1K a month). Why $12K? Because you have to draw the line somewhere.
SMBs have historically been ignored; now we’re convinced they’re the next frontier. In the past, there were economic disadvantages to building for and selling to SMBs. How could you economically sustain paying costly sales reps who are closing such small accounts? Don’t SMBs have a higher propensity to go out of business and have a reputation for being fickle when it comes to paying for software? Will your company in turn have a leaky bucket? Why invest heavily in product and engineering resources to sell a product for $1K ACV as opposed to $100K?
What changed? There’s been a gradual delaboring of sales forces, accelerated by COVID but in effect well before. It’s not a novel concept – how do you think B2C companies justify picking up one off consumers who on a good day will pay $15/month? It turns out the consumerization of the enterprise doesn’t just mean building a prettier product, but making it easier to adopt and following playbooks that B2C peers have set around digital distribution. This trend opened up the previously inaccessible market of SMBs who have been woefully under resourced, who would much rather focus on perfecting their craft than dealing with administrative work around maintaining an HR database, recruiting, logging payments, tracking inventory, or organizing expenses.
The markets have started to notice. Five years ago, there were 8 publicly listed SMB oriented SaaS companies, and today there are 25*. High growth SMB-focused companies often ask themselves what types of benchmarks to follow given most studies are generic to SaaS in general, which has selection bias towards enterprise businesses.
Importantly, this trend is not to be confused with product-led-growth, which is equally exciting but focuses on businesses where the product drives initial adoption, often as part of a small team within a larger enterprise, and expands throughout. Our focus is on software companies that depend on a long tail of lower ACV deals. We analyzed 24 of those businesses based on public data with the hopes of setting a new source of truth for the next generation of SMB enablers.
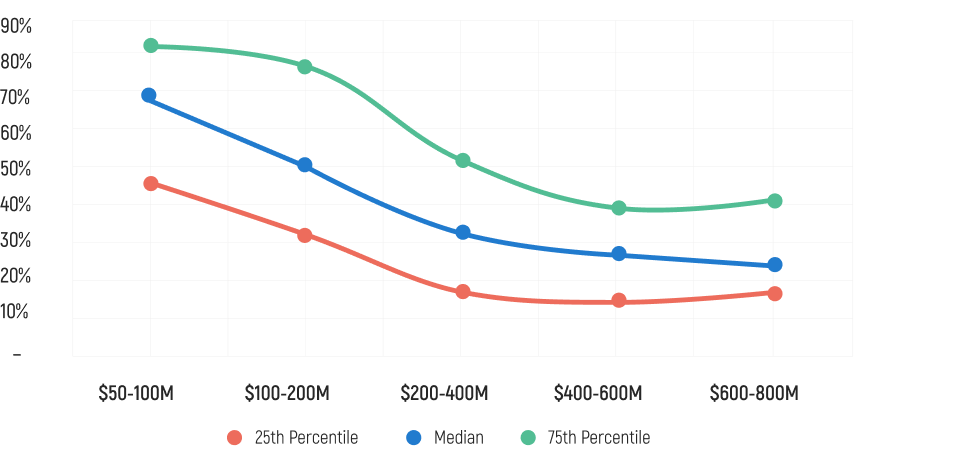
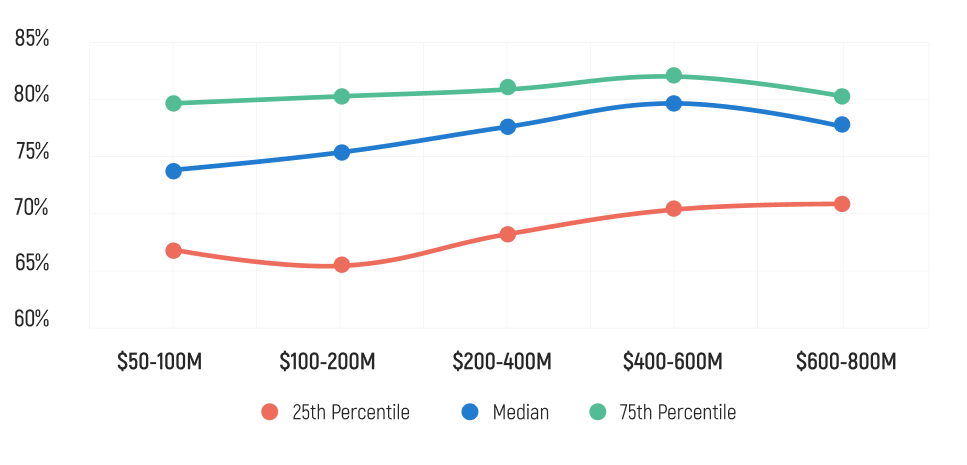
1. Growth metrics
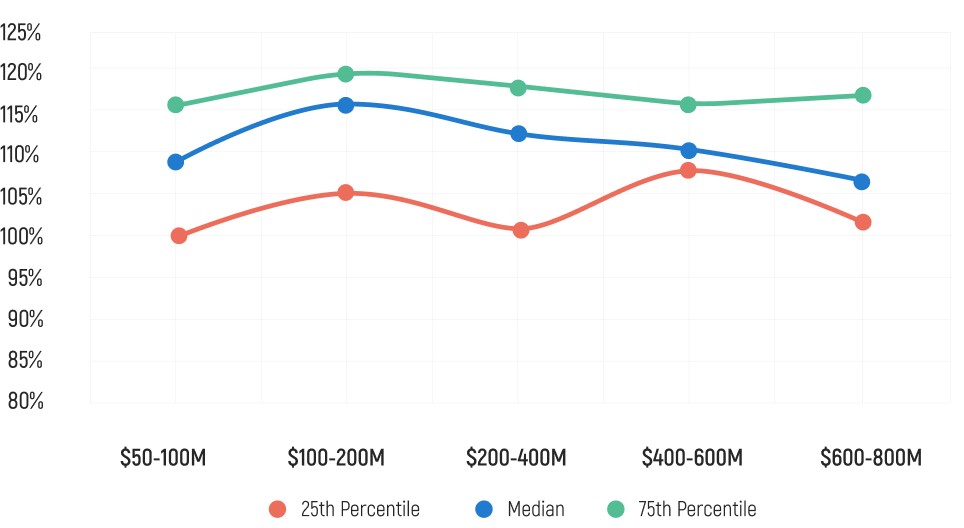
Revenue growth
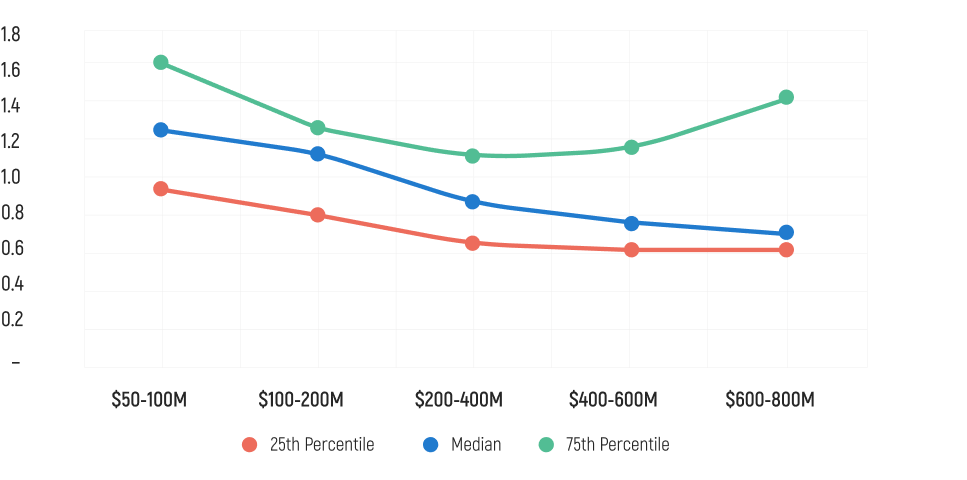
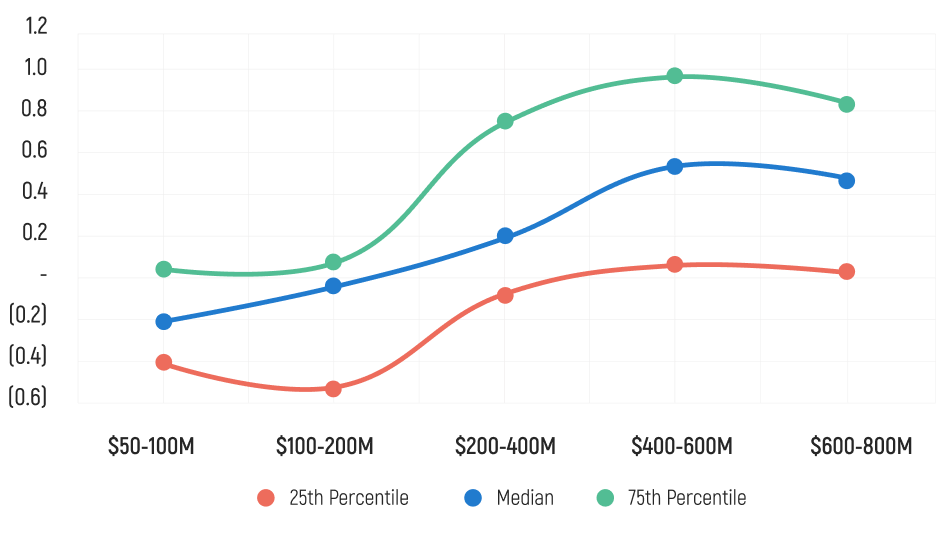
Magic Number
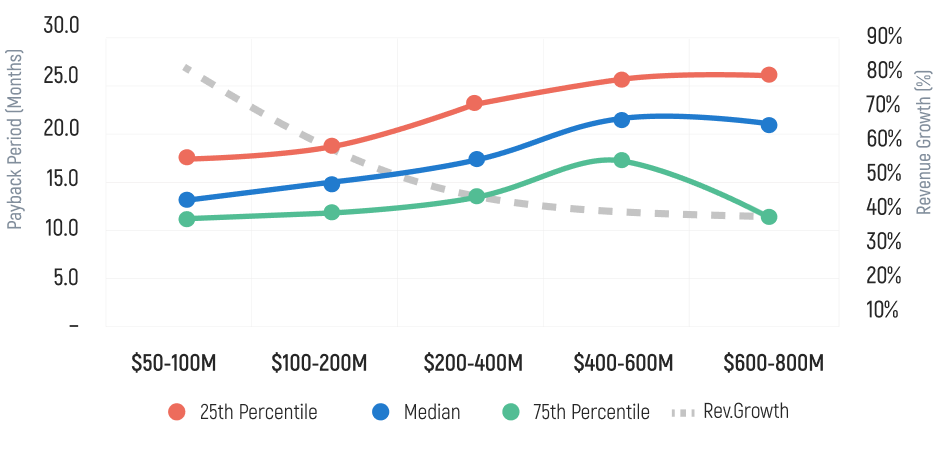
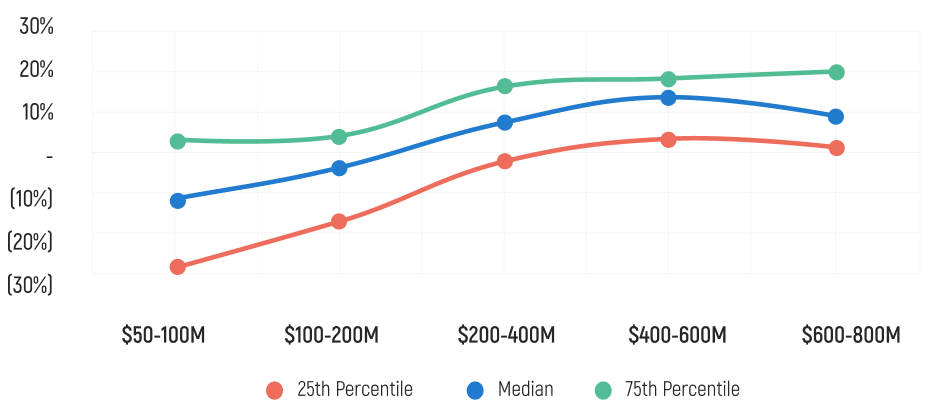
2. Payback Period with average growth rate overlayed
Payback Period
3. Back end economics
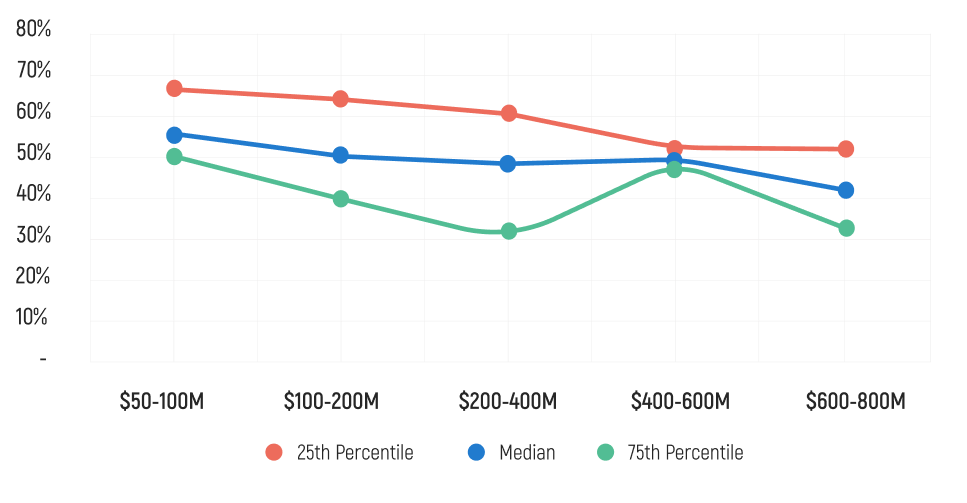
Net Dollar Retention
4. Operating Expenses as % Revenue
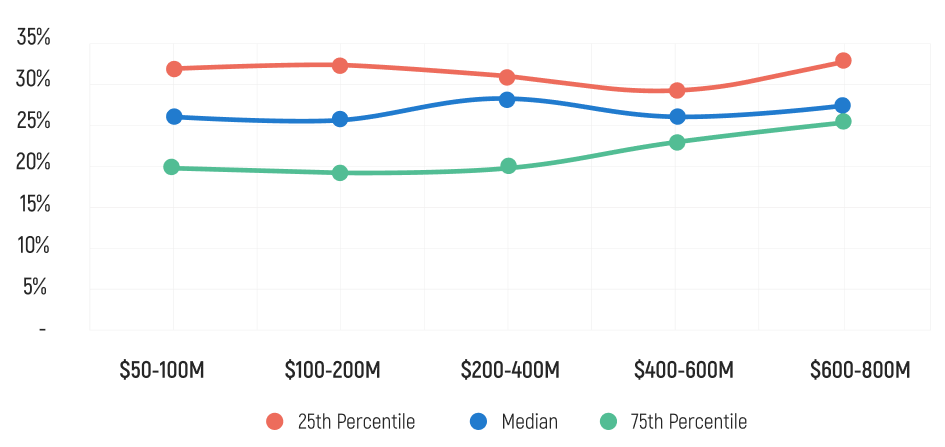
S&M as % Revenue
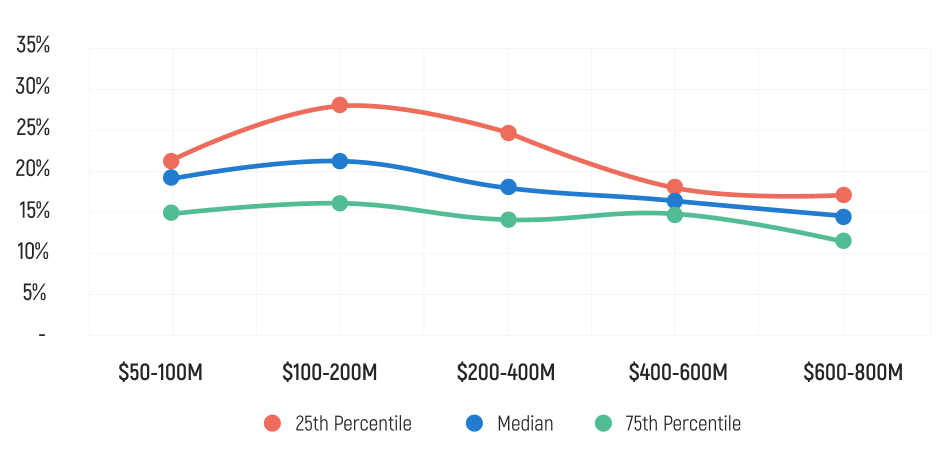
R&D as % Revenue
G&A as % Revenue
5. Miscellaneous
Gross Margin
Operating Cash Flow Margin
Burn Ratio (CFO / New Revenue)
6. SMB Software Index
SMB Software Index
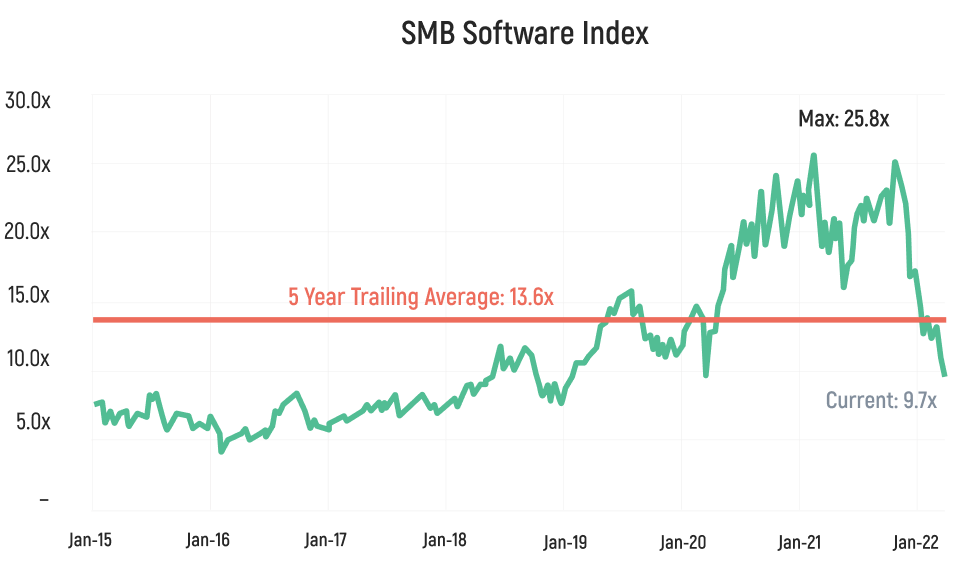
Source: Public filings and equity research as of February 2022.
*Note: Based on US publicly-listed SMB oriented SaaS, with ACVs <$12k.
Authors